The Systems Biology Core has the expertise to analyze data generated by multiple unbiased global approaches including, genomic, proteomic, and lipidomic technologies, allowing investigation of complex modes of regulation such as RNA-splicing, protein-DNA interactions, protein-protein interactions, and post-translational modifications. The Systems Biology Core also has considerable experience with these techniques and is, therefore, able to rapidly select, evaluate, and implement the appropriate technologies to aid in the characterization of the genes and proteins identified in the forward genetics screens.
Aim 1: Conduct genomic analysis in support of the Research Projects
The core guides the selection and implementation of the appropriate genomics techniques in support of the Projects. These include expression analysis techniques such as microarray, RNA-Seq, high-throughput multiplexed real-time PCR (Fluidigm), and genome-wide location analysis (Chip-Seq). The core also manages all the data yielded by these high-throughput techniques.
Aim 2: Conduct proteomic analysis in support of the Research Projects
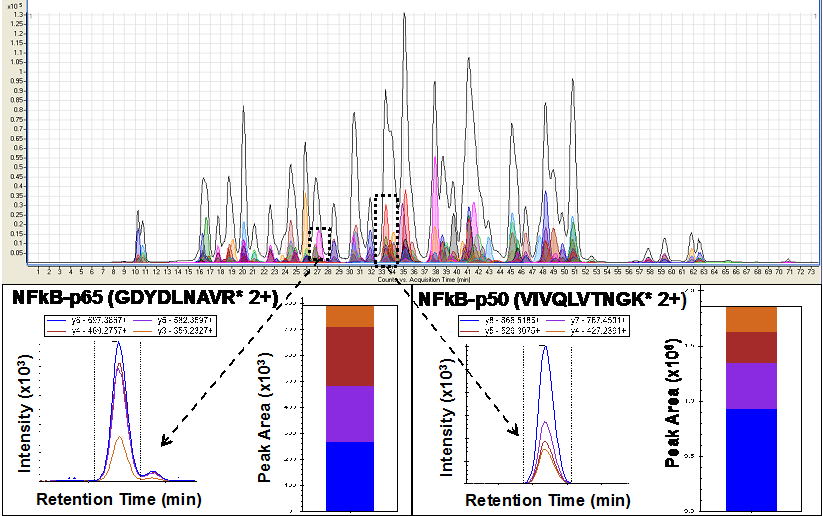
The core also implements a wide range of proteomics techniques as required by the needs of the Projects. Shotgun mass spectrometry can be used for protein identification. Quantitation of proteins is achieved using image-based analysis, isotopic labeling, and selective-reaction-monitoring. The core also manages proteomics data using several analysis pipelines and tools for data conversion, database searching, quantification, and visualization.
Aim 3: Conduct lipidomic analysis in support of the Research Projects
Many potent bioactive lipid mediators regulate a large number of pathways that control the host response to infection. The core uses mass spectrometry to perform highly multiplexed quantitative measurements of immune-modulating lipid species.